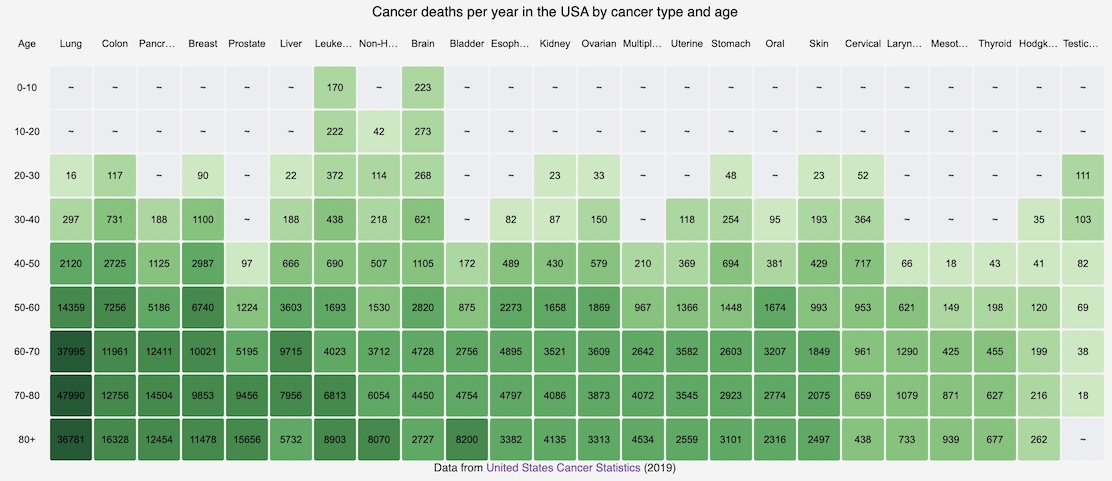
July 28, 2024 — Do you love those GitHub Activity Charts and want to make your own but don't know what they are called or what library to use and your work is busy and you have kids and sorry I'll call you back someone is crying?
Introducing Scroll's newest parser: heatrix!
heatrix let's you craft custom heatmap visualizations with the fewest keystrokes possible.
Heat Map + Matrix = Heatrix

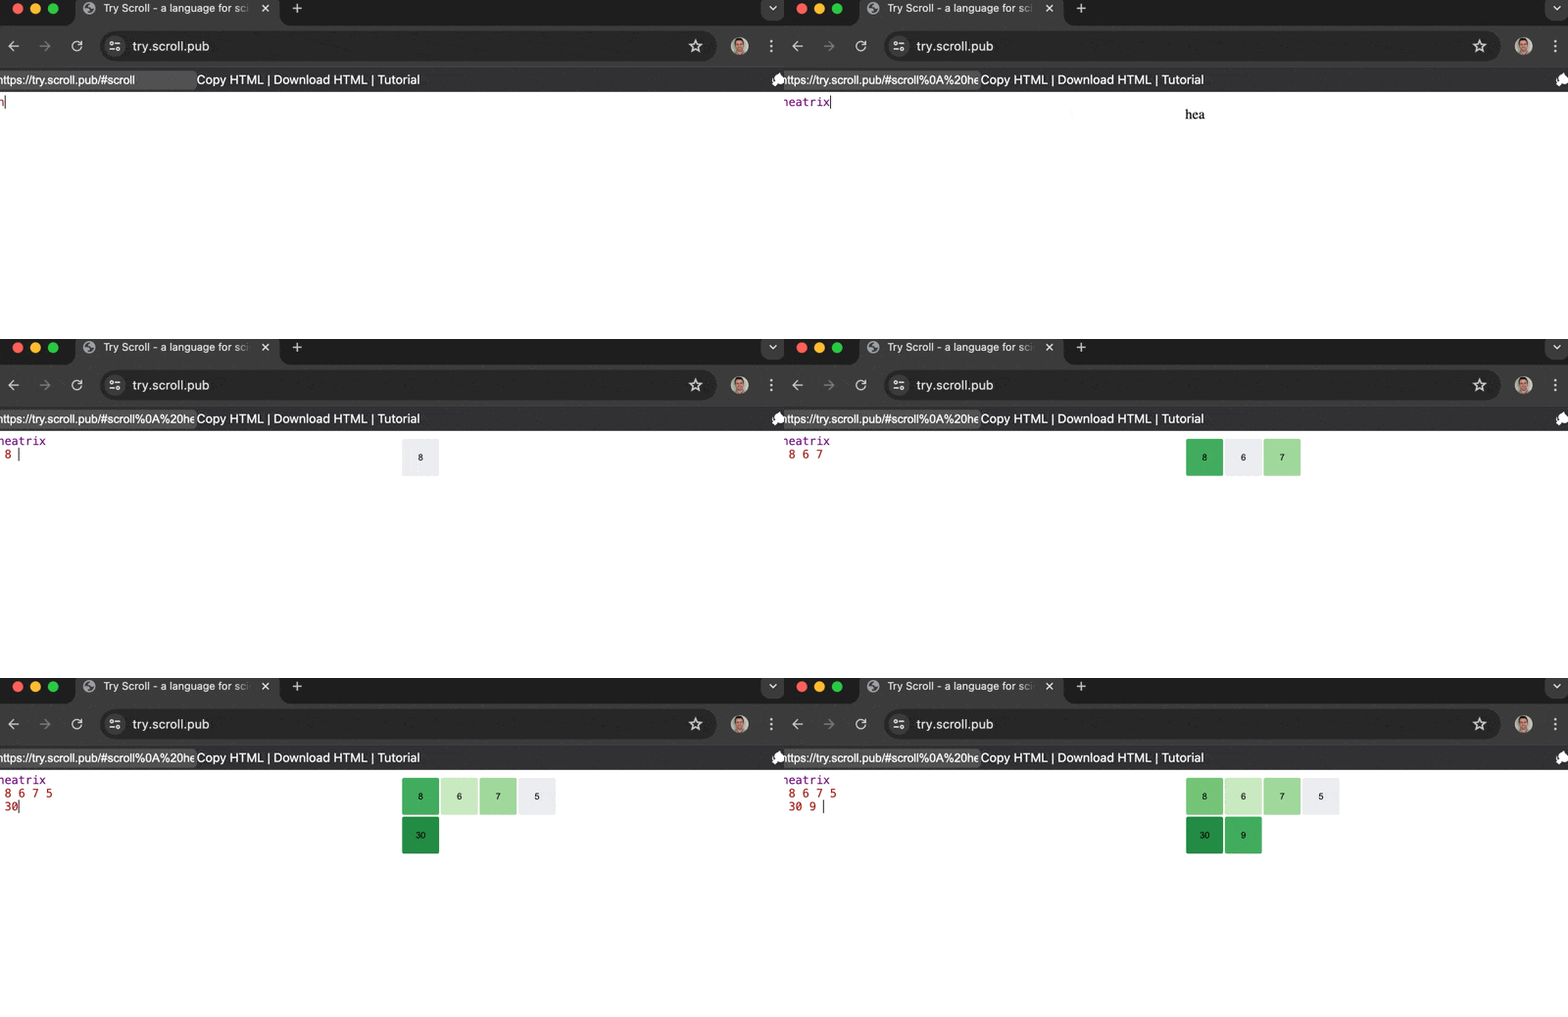
Source code. Gif made with CleanShotX.
*
Not just a library, it's a microlanguage!
heatrix is a microlang that let's you customize your visualizations using "directives":
Adjust the height/width of individual cells, columns, or rows:
heatrix
 h20;Scroll h20;PLDB
 400 700
Use your own custom color palettes and set your own thresholds:
heatrixAdvanced
 datatable

  h10;w30 '2015 '2016 '2017 '2018 '2019 '2020 '2021 '2022 '2023 '2024
  h30;w30; 0 0 5 1 2 11 15 10 12 56
 scale
  #ffebee 0
  #ffcdd2 1
  #ef9a9a 5
  #e57373 10
  #ef5350 25
  #b71c1c 50
*
Like Heatrix? There's more where that came from!
Join the World Wide Scroll Beta today!
If you like heatrix and want to see more stuff like this, but a folder on the World Wide Scroll beta and good things will come your way:
⁂